Amazon ALB Logs into Elasticsearch
Get ALB Logs into Elasticsearch

The AWS Appliation Load Balacer is quite a useful tool in our cloud native world. Its essentially a standard AWS ELB that understands the HTTP protocol and allows you to filter requests based on HTTP parts (like Host-Header) and route to your containers, compute instances or lambdas accordingly.
Did you know that ALBs (as well as ELB, NLB etc) log and profile the traffic going through them? The pupose of this post is to explain how to get those logs from your ALB to your ELK cluster.
For the sake of brevity in this post, I'm not going into how to install the ELK stack. There are tons of tutorials around the web for that. This post assumes you have some familiarity with ELK/EFK already and you are comfortable with managing it.
TL;DR
- Setup your S3 bucket and configure your ALB to send logs to it - check this AWS Link on how to do that
- Use the logstash input and filters defined below and configure your logstash instance with them
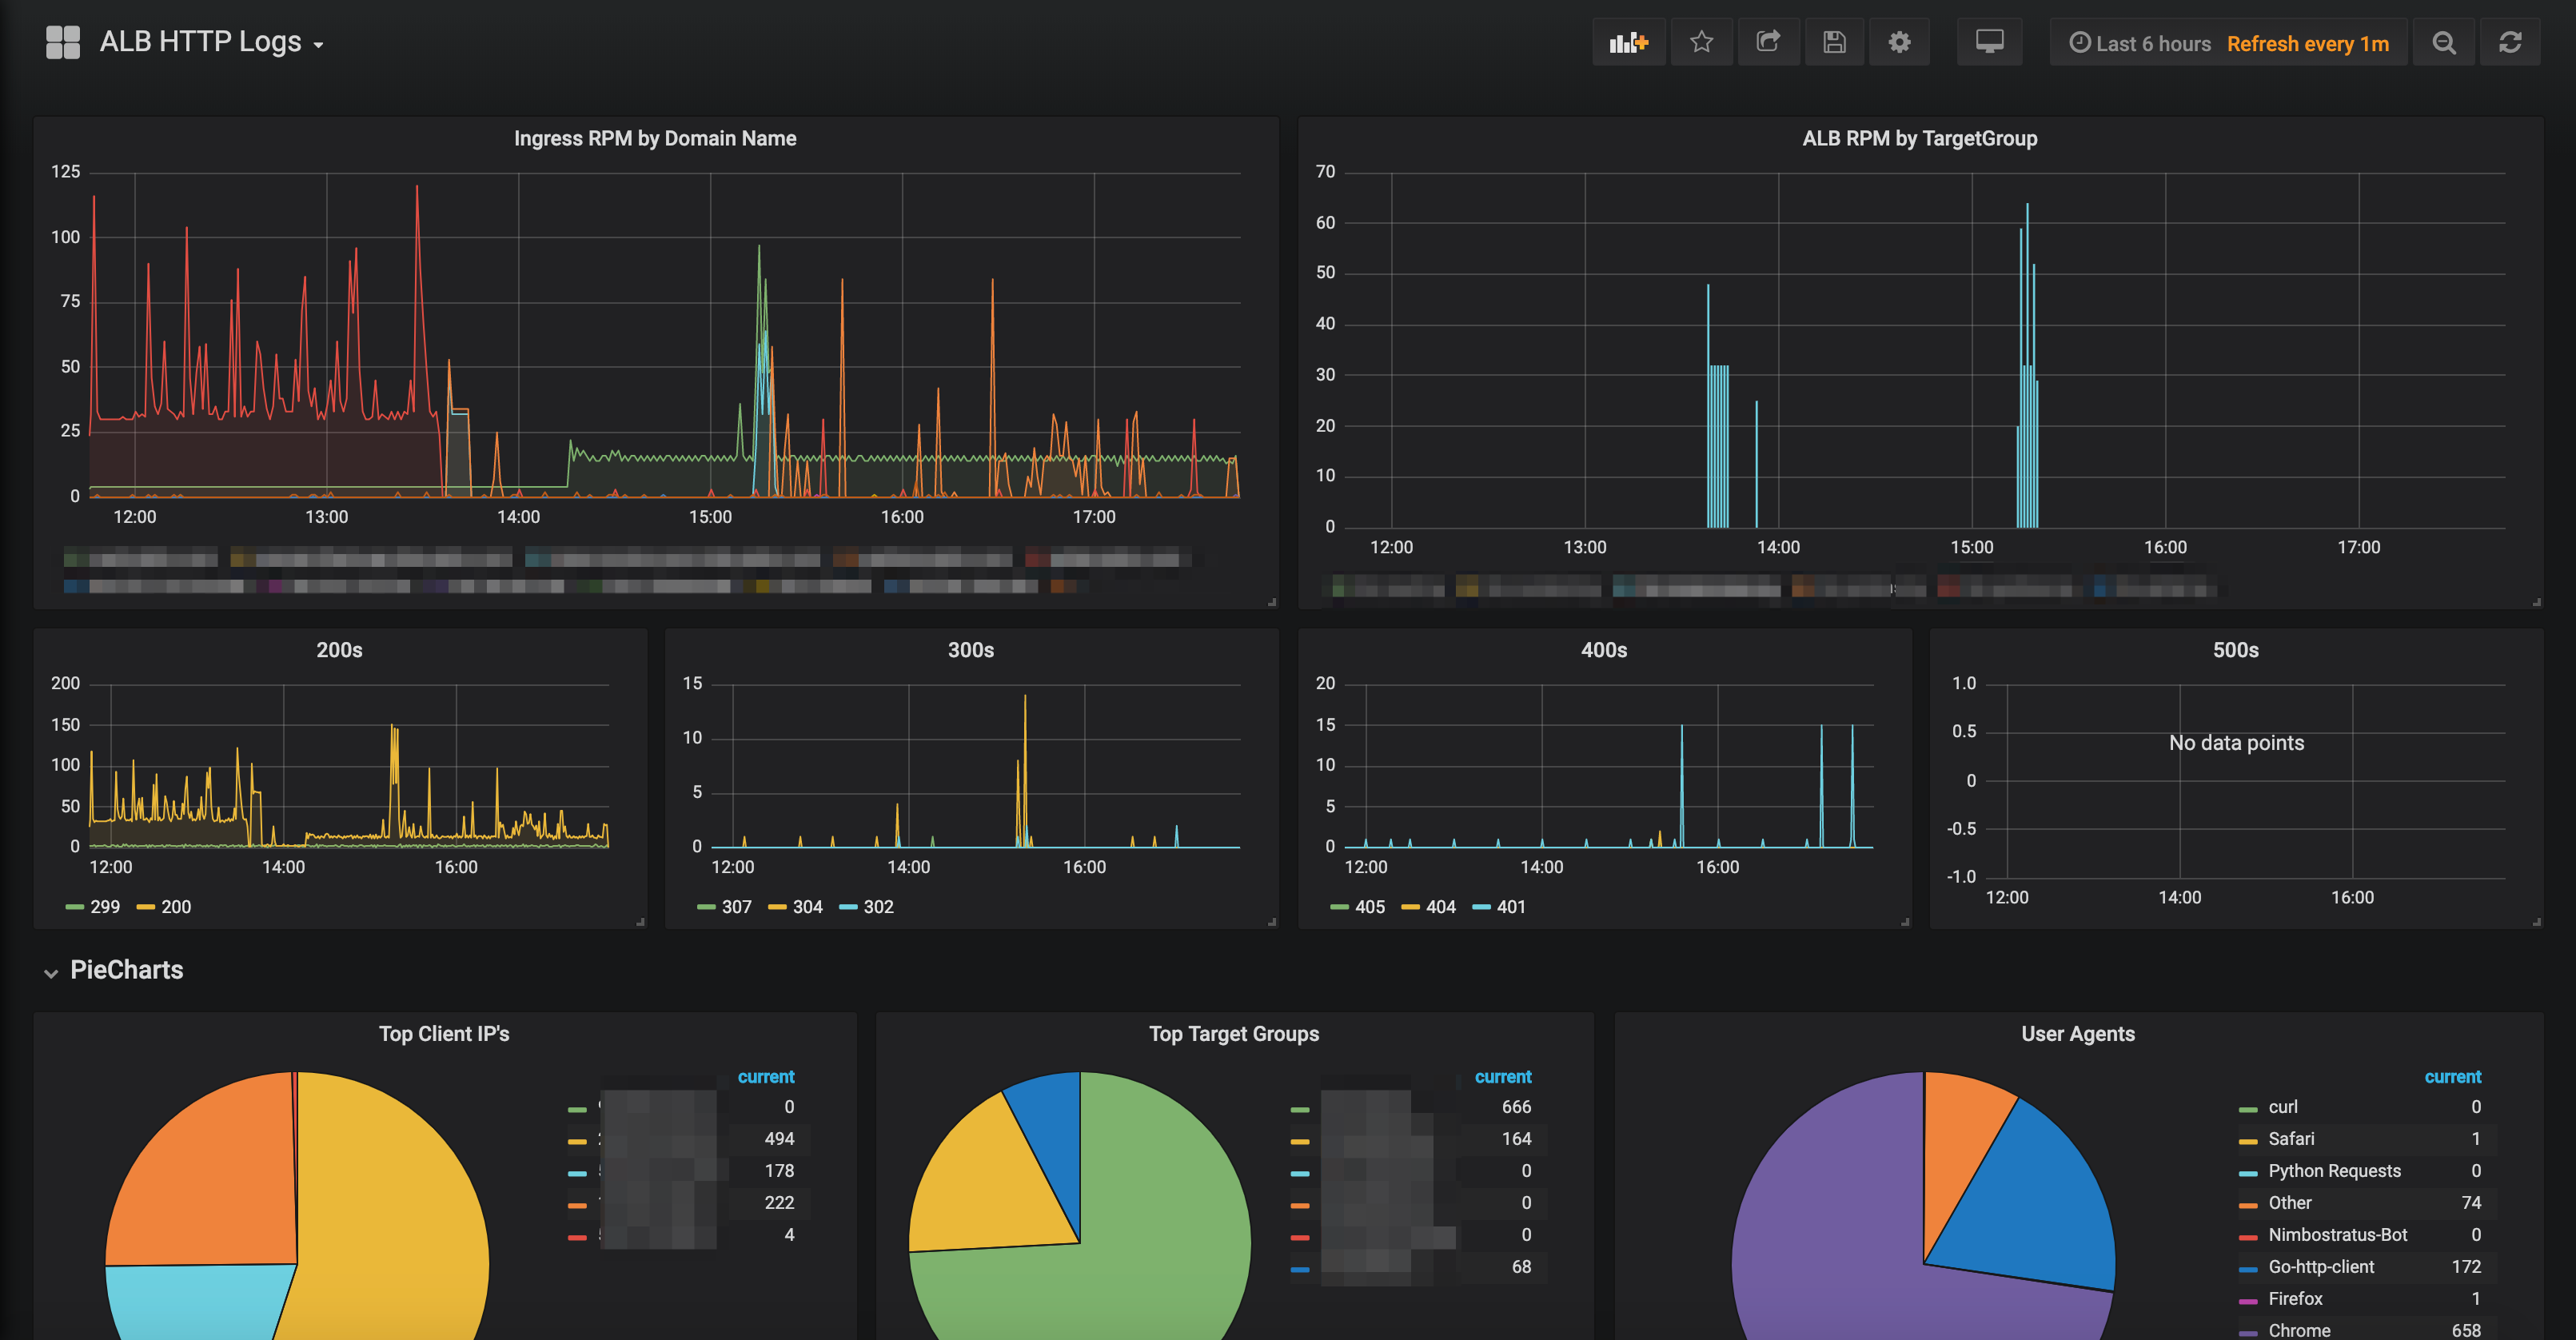
- Install the grafana dashboard from here
Without futher adeux, lets get started!
First, lets explain at a high level how this works. ALB's will only send thier logs to an S3 bucket. We will configure our ALB to send its logs to an S3 bucket we define, then we will configure Logstash to pull those logs from said S3 bucket, parse/enrich the messages and then load them into Elasticsearch.
First, create an S3 bucket your logs if you havnet already.
Please referr to this excellent article by Amazon on how to configure an S3 bucket for use by ALB logging. https://docs.aws.amazon.com/elasticloadbalancing/latest/application/load-balancer-access-logs.html
Once you have your bucket created and setup, and you see logs inside of , lets configure Logstash:
input {
    s3 {
        bucket => "mycompany-logs"
        prefix => "aws/alb/main-ingress-alb"
        add_field => {
            "doctype" => "aws-application-load-balancer"
            "es_index" => "alb-logs"
        }
    }
}

# Filter for parsing our ALB logs
filter {
    if [doctype] == "aws-application-load-balancer" or [log_format] == "aws-application-load-balancer" {
        grok {
            match => [ "message", '%{NOTSPACE:request_type} %{TIMESTAMP_ISO8601:log_timestamp} %{NOTSPACE:alb-name} %{NOTSPACE:client} %{NOTSPACE:target} %{NOTSPACE:request_processing_time:float} %{NOTSPACE:target_processing_time:float} %{NOTSPACE:response_processing_time:float} %{NOTSPACE:elb_status_code} %{NOTSPACE:target_status_code:int} %{NOTSPACE:received_bytes:float} %{NOTSPACE:sent_bytes:float} %{QUOTEDSTRING:request} %{QUOTEDSTRING:user_agent} %{NOTSPACE:ssl_cipher} %{NOTSPACE:ssl_protocol} %{NOTSPACE:target_group_arn} %{QUOTEDSTRING:trace_id} "%{DATA:domain_name}" "%{DATA:chosen_cert_arn}" %{NUMBER:matched_rule_priority:int} %{TIMESTAMP_ISO8601:request_creation_time} "%{DATA:actions_executed}" "%{DATA:redirect_url}" "%{DATA:error_reason}"']
        }
        date {
            match => [ "log_timestamp", "ISO8601" ]
        }
        mutate {
            gsub => [
                "request", '"', "",
                "trace_id", '"', "",
                "user_agent", '"', ""
            ]
        }
        if [request] {
            grok {
                match => ["request", "(%{NOTSPACE:http_method})? (%{NOTSPACE:http_uri})? (%{NOTSPACE:http_version})?"]
            }
        }
        if [http_uri] {
            grok {
                match => ["http_uri", "(%{WORD:protocol})?(://)?(%{IPORHOST:domain})?(:)?(%{INT:http_port})?(%{GREEDYDATA:request_uri})?"]
            }
        }
        if [client] {
            grok {
                match => ["client", "(%{IPORHOST:c_ip})?"]
            }
        }
        if [target_group_arn] {
            grok {
                match => [ "target_group_arn", "arn:aws:%{NOTSPACE:tg-arn_type}:%{NOTSPACE:tg-arn_region}:%{NOTSPACE:tg-arn_aws_account_id}:targetgroup\/%{NOTSPACE:tg-arn_target_group_name}\/%{NOTSPACE:tg-arn_target_group_id}" ]
            }
        }
        if [c_ip] {
            geoip {
                source => "c_ip"
                target => "geoip"
            }
        }
        if [user_agent] {
            useragent {
                source => "user_agent"
                prefix => "ua_"
            }
        }
    }
}

output {
    if [es_index] {
        elasticsearch {
            hosts => ["http://localhost:9200"]
            index => "%{[es_index]}-%{+YYYY.MM.dd}"
        }
    }
}
Lets talk about this config.
First, I borrowed some of this configuration from: https://parall.ax/blog/view/3240/aws-application-load-balancer-alb-logstash-parsing-pattern <-- Thank you! I added some additional parsing and mapping and it seems to be working well for us.
Second you have noticed that in our input section for s3, we didnt define any access_key or secret_key. How excatally is this host supposed to get the logs then? In our environment we start up logstash with AWS_ACCESS_KEY and AWS_SECRET_KEY set as environment variables, or we use IAM Instance profiles attached to our logstash instances that have proper access to these buckets. This way no credentials are ever stored in the logstash configs or stored in our SCM.
Keep in mind that your ALB logs will be about 5 mintues delayed getting to ELK. This is because whatever job in the background in AWS only sends the logs to the s3 bucket every 5 minutes. I'm not sure how to make these "real time", but I would love to hear options if you know them.
I hope that helps get your ALB logs into your ELK stack for you. If you want the code that powers this (as well as our Grafana dashboard), go grab it here: https://github.com/nickmaccarthy/alb-logs-into-elk